
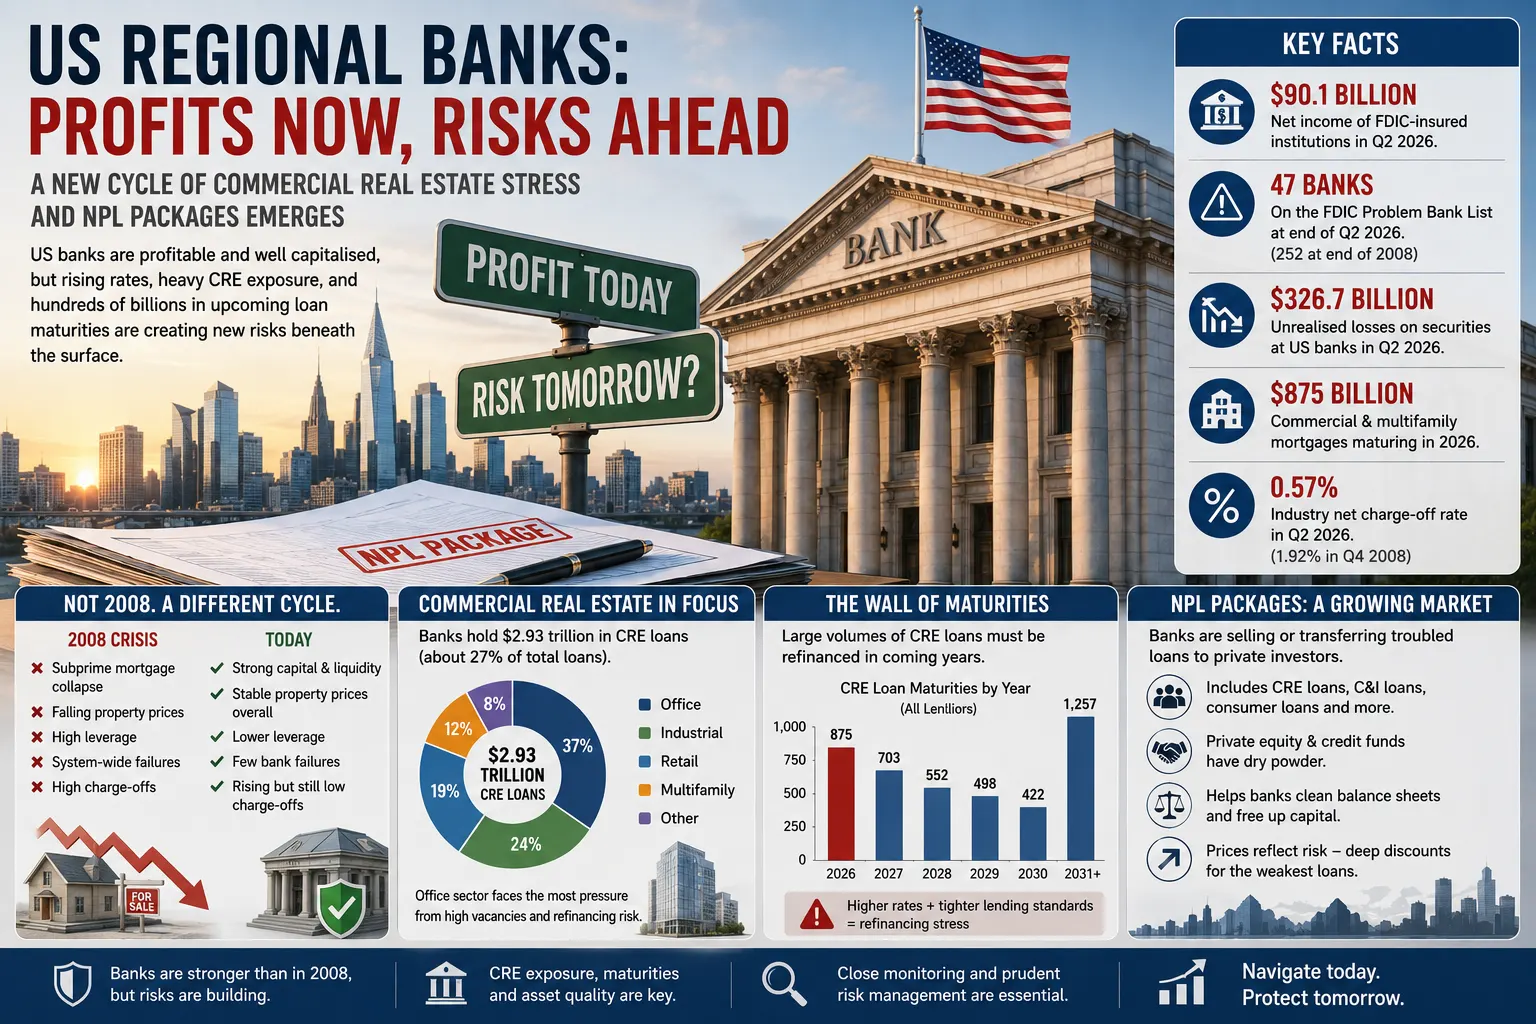
America’s 4,238 federally insured banks and savings institutions earned $90.1 billion in the second quarter of 2026, while only 47 institutions appeared on the FDIC’s confidential “Problem Bank List”. Those numbers describe a banking system that is profitable and, in aggregate, well capitalised. Yet beneath them sits a second reality: hundreds of billions of dollars of commercial-property debt must still be refinanced, some regional banks remain heavily concentrated in commercial real estate, $326.7 billion of unrealised securities losses remain on bank balance sheets, and portfolios of unwanted loans are increasingly being transferred to private investors.
The apparent contradiction is the key to understanding the current US banking cycle. This is not a straightforward rerun of 2008, when deteriorating mortgage credit, collapsing property prices, fragile securitisation structures and excessive leverage spread losses through much of the financial system. Nor is the present situation free of danger. It is a slower process in which higher interest rates are exposing weak property economics, refinancing problems and bank-specific concentrations accumulated during the long period of exceptionally cheap money.
Regional and community banks deserve particular attention because they play a disproportionately important role in financing commercial property, local businesses and middle-market companies. Unlike the largest Wall Street institutions, many rely heavily on conventional lending and deposits. A bank with too much exposure to one property type or geographic market can therefore experience severe problems even while national banking statistics remain reassuring.
The development of non-performing loan portfolios, often described in the market as NPL packages, must also be understood carefully. Not every loan sold by a bank is distressed, and not every troubled loan is immediately sold. Banks can modify loans, extend maturities, demand additional equity, increase reserves, take partial charge-offs, foreclose, transfer loans to held-for-sale portfolios or sell groups of loans to private equity and private-credit investors. The current restructuring cycle includes all of these mechanisms.
$90.1 billion: aggregate net income of FDIC-insured institutions in the second quarter of 2026.
47: banks on the FDIC Problem Bank List at the end of the second quarter, compared with 252 at the end of 2008 and 884 at the end of 2010.
$326.7 billion: unrealised losses on available-for-sale and held-to-maturity securities at US banks in the second quarter of 2026.
$875 billion: commercial and multifamily mortgages across all lender types scheduled to mature during 2026.
0.57%: industry net charge-off rate in the second quarter of 2026, compared with 1.92% in the fourth quarter of 2008.
The American Banking System Has Changed Dramatically Since 2008
The first structural change is consolidation. At the end of 2008 there were 8,305 FDIC-insured depository institutions. By the second quarter of 2026 only 4,238 remained. The number has therefore fallen by almost half, reflecting mergers, failures, acquisitions and a long period in which comparatively few new banks were created.
Consolidation has produced a system dominated at the top by a small number of enormous national banks, surrounded by large regional institutions and thousands of smaller community banks. The term “regional bank” itself has no single universally applicable regulatory definition: different analyses use different asset thresholds. Economically, however, the important characteristic is that these institutions often depend more heavily on relationship lending, commercial deposits and regional property markets than globally diversified banking groups do.
The concentration can be advantageous. A local bank may understand its borrowers, properties and markets better than a national lender operating through standardised models. But geographic and sector concentration can also magnify losses. If a regional economy weakens or one property sector suffers a structural shock, the same problem can affect numerous borrowers simultaneously.
This was an important part of the 2008–2013 banking crisis and is relevant again today. The FDIC’s historical analysis found that many smaller banks that failed after 2008 had accumulated large concentrations of poorly underwritten commercial real-estate loans, particularly acquisition, development and construction lending. The public memory of 2008 understandably focuses on subprime residential mortgages and Wall Street securitisation, but commercial-property lending was an important reason hundreds of smaller institutions ultimately failed.
The Long Era of Cheap Money Created the Conditions for Today’s Problem
After the global financial crisis, US interest rates remained historically low for much of the following decade. The pandemic then pushed monetary policy into an even more unusual environment. Short-term rates were reduced almost to zero, enormous quantities of government bonds and mortgage securities were purchased by the Federal Reserve, and borrowing costs across the economy fell sharply.
Low rates supported property valuations through two mechanisms. Borrowers could service larger loans because interest expenses were low, while investors were willing to accept lower returns on property because yields on safer assets were also low. Commercial-property capitalisation rates consequently fell in many markets, increasing the theoretical value of a given stream of rental income.
Banks competed aggressively for lending opportunities during this period. Office towers, apartment buildings, hotels, warehouses and other commercial properties could be financed at borrowing costs that seemed sustainable while interest rates remained low. Many commercial mortgages were structured with maturities of five, seven or ten years rather than the long fixed-rate structure common in American residential mortgages.
This created delayed interest-rate risk. A property owner might have no difficulty servicing a loan during its original term but encounter a radically different financing environment when that loan matured. The risk would therefore remain largely invisible until refinancing became necessary.
The Federal Reserve’s Tightening Cycle Exposed the Refinancing Gap
When inflation accelerated after the pandemic, the Federal Reserve raised interest rates rapidly. The immediate effect on floating-rate borrowers was obvious: interest expenses increased. The slower effect on fixed-rate commercial property loans has taken years to become visible because it arrives when loans mature and must be refinanced.
Suppose a building was financed when debt was inexpensive and investors valued property using a very low capitalisation rate. The borrower may now confront a refinancing rate several percentage points higher, while the market value of the building has simultaneously fallen. A lender that once considered the loan conservative may therefore be unwilling to refinance the same principal balance.
This refinancing mechanism is central to today’s NPL problem. A borrower does not have to stop collecting rent for a loan to become difficult. The property can continue generating positive cash flow and still fail a modern refinancing test because its value has fallen or because the interest burden on a replacement loan would be too high.
The Mortgage Bankers Association estimates that $875 billion of the roughly $5 trillion of outstanding US commercial and multifamily mortgages held across banks, insurance companies, securitisations and other investors are scheduled to mature during 2026. Another $652 billion is scheduled for 2027. The 2026 figure is lower than the $957 billion scheduled for 2025, suggesting that the maturity wall is beginning to decline, but the amount requiring refinancing remains substantial.
$875 billion of commercial and multifamily mortgage debt is scheduled to mature in 2026. The figure covers the wider US commercial mortgage market, not banks alone, but it illustrates the scale of refinancing decisions that can create new distressed loans.
A Simple Property Calculation Explains How a Performing Loan Can Become Troubled
Commercial properties are frequently valued by dividing their net operating income by a market capitalisation rate. The following calculation is deliberately illustrative rather than a forecast, but it demonstrates why refinancing can become difficult even without a dramatic collapse in rental income.
Illustrative Commercial Property Refinancing Example
| Scenario | Property value | $65m loan-to-value |
|---|---|---|
| $5m income, 5% cap rate | $100.0m | 65% |
| $5m income, 7% cap rate | $71.4m | 91% |
| $4m income, 7% cap rate | $57.1m | 114% |
Illustrative model calculation. Property value equals net operating income divided by the assumed capitalisation rate; figures are not a market forecast.
In the first scenario, a $65 million mortgage finances only 65% of a $100 million property. Nothing about the debt appears particularly aggressive. If the market capitalisation rate rises from 5% to 7%, however, the same $5 million income stream supports a theoretical value of only about $71 million. The original loan suddenly represents approximately 91% of the property value.
If rental income simultaneously declines to $4 million, the same property is worth about $57 million under the simplified model. The mortgage is then greater than the theoretical property value. A new lender willing to finance only 65% of that value might offer roughly $37 million, leaving the owner needing almost $28 million of additional capital to repay the existing $65 million loan.
This is how a loan can move from apparently sound to criticised, modified or non-performing without anything resembling the residential mortgage defaults of 2008. The underlying problem is the interaction between debt, interest rates, rental income and property valuation.
Office Buildings Are the Most Visible Weak Point
No major property sector has experienced a more fundamental change than offices. Remote and hybrid working reduced demand for space after the pandemic, particularly for older buildings in large central business districts. Companies have generally continued to lease offices, but many require less space and increasingly prefer modern, energy-efficient buildings in the best locations.
This has divided the market. High-quality buildings can still attract tenants, while weaker offices face high vacancies, expensive refurbishment requirements and falling rents. A building designed for a workforce that commuted to the office five days a week may no longer have an obvious economic use at its previous valuation.
Evidence from the commercial mortgage-backed securities market demonstrates how severe the stress can become. Trepp reported an overall CMBS delinquency rate of 7.85% in August 2026, with the office delinquency rate at 12.00%. Multifamily CMBS stood at 7.69%, while industrial property remained much stronger at 1.14%.
Those figures require an important qualification. CMBS loans are securitised commercial mortgages and are not the same as commercial-property loans held directly on bank balance sheets. A 12% office delinquency rate in CMBS therefore does not mean that 12% of bank office loans are delinquent. It does, however, provide powerful evidence that the underlying office-property market remains under significant stress.
Commercial Real Estate Is Not One Market
Describing every commercial-property loan as dangerous would be equally misleading. Industrial warehouses, logistics centres, data infrastructure, neighbourhood retail, hotels, apartments and offices respond to very different economic forces. Even within offices, a recently constructed building with strong tenants can have little in common with an older half-empty tower in another city.
Geography matters as well. Property markets in New York, San Francisco, Chicago, Dallas, Miami or smaller regional centres can have very different vacancy rates, population trends, rent regulation and construction pipelines. A national CRE statistic can therefore hide both severe local problems and very strong local markets.
Multifamily lending illustrates the point. The long-term shortage of housing in many American cities supports apartment demand, but some loans were written at aggressive valuations during the low-rate period. Certain markets subsequently experienced rapid new construction, while New York rent-regulated properties face a distinctive combination of regulation, operating costs and financing constraints.
In June 2026, OceanFirst completed the sale of approximately $1.3 billion of New York metropolitan-area multifamily loans acquired through its merger with Flushing Financial. More than 1,400 loans were included and $736 million of the portfolio was backed by properties with rent-regulated exposure. The bank described the transaction as a balance-sheet repositioning designed to reduce commercial-real-estate concentration and rent-regulation risk.
That transaction illustrates an important feature of the current loan-sale market: a large portfolio sale does not automatically constitute an NPL sale. Banks increasingly dispose of performing or mixed-quality portfolios because they want to reduce concentration before loans actually become distressed.
What an NPL Package Actually Is
A non-performing loan is generally a loan on which the borrower has stopped making contractual payments for a sufficiently long period or where the bank no longer expects normal repayment and places the loan on non-accrual status. Accounting and regulatory definitions differ depending on the measure being used, which is why apparently similar delinquency statistics are not always directly comparable.
Before a loan formally becomes non-performing, it can move through several stages of deterioration. A bank may place it on a watch list, classify it as “special mention”, identify it as criticised or classified, demand additional collateral, increase its allowance for credit losses or negotiate a modification. Non-accrual status comes later for many loans.
An NPL package is not a special financial instrument created by regulation. It is normally a pool of problematic loans assembled for sale to an investor capable of working them out. Buyers can include private-equity firms, private-credit funds, specialist distressed-debt investors, real-estate companies and asset managers.
The package may contain mortgages secured by different properties, loans to one borrower, assets in one geographic area or a mixture of loans and associated claims. The buyer pays a price reflecting expected recoveries, legal complexity, collateral values, the time required to resolve the loans and the return demanded for taking the risk.
There is consequently no single official nationwide number representing “US NPL packages”. Regulatory statistics measure nonaccrual loans, past-due loans, charge-offs, reserves and bank balance sheets. Portfolio sales are recorded through individual institutions and transactions, and the market also contains performing loans sold for strategic reasons. Treating all bank loan sales as distressed-debt disposals would materially overstate the NPL problem.
Why Banks Sell Troubled Loans Instead of Waiting
A bank facing a problem loan has several choices. It can continue negotiating with the borrower, extend the maturity, modify the interest rate, take additional collateral, sell the loan, foreclose or charge off the amount it no longer expects to recover. None of these options is automatically superior.
Modification can be rational when a property remains economically viable but temporarily cannot refinance. Federal Reserve research published in 2026 examined concerns that banks had simply been extending commercial real-estate loans to avoid recognising losses after the 2023 banking stress. The study found that extensions predominantly addressed temporary payment frictions and that banks frequently demanded additional principal repayment or stronger income performance, with generally favourable subsequent results.
This is important because the popular phrase “extend and pretend” can oversimplify what lenders are doing. A bank that gives a fundamentally viable borrower another year to refinance may recover considerably more than it would through an immediate forced sale. Conversely, repeated extensions of an economically insolvent property can merely postpone the loss.
A portfolio sale offers certainty. The bank crystallises a loss or accepts a discount today but removes future credit, operational and concentration risk. It also frees management from years of individual workouts and can reduce the amount of capital consumed by risky assets.
This explains why loan sales can increase even when aggregate NPL ratios are not exploding. Banks are attempting to prevent yesterday’s concentration from becoming tomorrow’s solvency problem.
Flagstar Shows How a Stressed Regional Balance Sheet Can Be Worked Down
Flagstar Bank provides a useful current example of the process, although its experience should not be treated as representative of every regional lender. The institution has spent several years reducing exposure associated with New York multifamily and commercial property after the former New York Community Bancorp came under severe investor scrutiny.
At the end of June 2026, Flagstar reported $2.805 billion of non-accrual loans, 12% below the level a year earlier but 5% above the previous quarter. Multifamily and commercial-real-estate exposure declined by $1.5 billion during the quarter, while classified and substandard loans also declined. The bank nevertheless returned a quarterly profit of $34 million.
This is what a modern bank workout can look like. Credit problems do not disappear, but assets are gradually resolved, provisions and charge-offs are absorbed through earnings and the balance sheet is reduced or repositioned. If enough capital and liquidity remain available, substantial loan deterioration does not necessarily result in failure.
The Banking Industry as a Whole Does Not Currently Show 2008-Level Credit Deterioration
The latest FDIC data are important precisely because they contradict the idea that US banks are already in a generalised NPL crisis. The industry’s past-due and non-accrual rate fell to 1.44% in the second quarter. The net charge-off rate declined to 0.57%. Loan balances increased 1.8% during the quarter and 6.8% from a year earlier.
Community-bank earnings also improved, rising 8.2% from the first quarter. Only 4.4% of community banks were unprofitable. The industry therefore remains capable of generating substantial earnings that can absorb future credit losses.
The FDIC’s Problem Bank List contained 47 institutions at the end of the second quarter, down seven from the previous quarter and equal to only 1.11% of all insured institutions. The FDIC describes a problem-bank share between approximately 1% and 2% as normal during non-crisis periods.
That does not mean all 4,191 institutions outside the list are equally healthy. The list is deliberately confidential at the institution level, and regional banks can encounter problems quickly. But the aggregate numbers are inconsistent with the broad deterioration visible by the end of 2008.
US Banking Stress: 2008 Compared With 2026
| Indicator | 2008 crisis period | Latest 2026 reading |
|---|---|---|
| FDIC-insured institutions | 8,305 at year-end | 4,238 in Q2 |
| Problem banks | 252 at year-end | 47 in Q2 |
| Problem-bank share | 3.03% | 1.11% |
| Net charge-off rate | 1.92% in Q4 | 0.57% in Q2 |
| Quarterly industry result | $32.1bn loss in Q4 | $90.1bn profit in Q2 |
Source: Federal Deposit Insurance Corporation. Quarterly figures refer to different points in the economic cycle and should be interpreted as indicators rather than direct like-for-like forecasts.
The Difference in Bad-Loan Formation Is Even More Striking
At the end of 2008, noncurrent loans at insured banks had reached $230.8 billion, having increased by $120.1 billion — 108.5% — in only twelve months. The noncurrent loan rate reached 2.93%, its highest level since 1992. Construction and development loans had an extraordinary 8.55% noncurrent rate.
Net charge-offs reached $38 billion during the fourth quarter alone, equivalent to an annualised 1.92% of loans. Charge-offs were rising across every major loan category, including construction, residential mortgages, commercial lending and credit cards. Real-estate lending accounted for almost two thirds of the year-on-year increase.
The current FDIC measure cited above is broader in one respect because the 2026 past-due and non-accrual measure includes loans at least 30 days overdue as well as non-accrual assets, whereas the historical “noncurrent” measure is not identical. The two delinquency percentages should therefore not be mechanically compared. The charge-off rates and the direction of deterioration nevertheless show how different the two environments are.
In 2008, bad credit was spreading rapidly through multiple categories while the industry was losing money. In 2026, overall asset-quality measures have recently improved and aggregate bank profits are substantial, even while particular CRE portfolios remain under pressure.
2008 Was Primarily a Credit Crisis — 2023 Was Primarily a Duration and Liquidity Crisis
The failures of Silicon Valley Bank, Signature Bank and First Republic in 2023 introduced a different risk that remains relevant today. Those institutions were not replicas of Lehman Brothers or the mortgage lenders that failed during the global financial crisis. Their vulnerability involved a combination of concentrated business models, large quantities of uninsured deposits, interest-rate exposure and assets whose market value had fallen substantially.
Silicon Valley Bank had invested large deposit inflows in longer-duration fixed-rate securities while interest rates were exceptionally low. When rates rose, the market value of those securities declined. The losses could remain unrealised while securities were held, but the bank faced a different problem when depositors demanded their money.
On 9 March 2023, more than $40 billion left Silicon Valley Bank in a single day. Signature Bank subsequently lost approximately one fifth of its deposits in hours. First Republic also experienced enormous withdrawals. Digital banking and instant communication demonstrated that a modern bank run could develop far faster than the runs regulators had historically modelled.
FDIC research published in May 2026 confirms the importance of deposit structure. Depositors with substantial uninsured balances were far more likely to withdraw funds from the three failed banks, while fully insured retail depositors generally remained stable. The size and concentration of deposit accounts also mattered.
That episode provides perhaps the most relevant warning for current regional banks. A bank does not need enormous credit losses to fail if depositors suddenly demand cash and the assets that must be sold to provide that cash are worth substantially less than their accounting value.
The $326.7 Billion Number Is Important — but It Is Not an NPL Number
US banks still carried $326.7 billion of unrealised losses on available-for-sale and held-to-maturity securities in the second quarter of 2026. The figure increased slightly from the previous quarter but was $68.6 billion lower than a year earlier.
These losses are sometimes combined rhetorically with non-performing loans to suggest that banks have hundreds of billions of dollars of bad debt. That is incorrect. A Treasury bond or government-backed mortgage security that has declined because interest rates increased can continue paying every contractual dollar owed to the bank. Its market price has fallen because a newly issued security now offers a higher yield.
If the bank can hold the security until maturity, much of the accounting valuation gap can disappear as the bond approaches repayment. The danger arises if a bank needs cash immediately and must sell the asset at its lower current market value. The previously unrealised loss then becomes realised and reduces capital.
The distinction between credit risk and interest-rate risk is therefore essential. NPLs represent borrowers failing or becoming unlikely to repay. Unrealised bond losses represent market repricing. They become dangerous together when credit losses weaken a bank’s capital while deposit withdrawals force it to realise losses elsewhere on the balance sheet.
Are US Banks Over-Indebted?
Banks are highly leveraged businesses by design. Deposits are liabilities: when a customer deposits $100,000, the bank owes that money to the customer while investing or lending much of it elsewhere. Comparing a bank with an ordinary industrial company can therefore create the misleading impression that every bank is excessively indebted.
The more relevant questions are how much loss-absorbing capital the bank holds, how risky its assets are, whether its funding is stable and whether it has enough liquidity to survive deposit withdrawals. On these measures the current industry is materially stronger than it was entering the global financial crisis.
The FDIC reported a Tier 1 risk-based capital ratio of 13.75% in the second quarter of 2026 and a leverage capital ratio of 8.98%. Both declined slightly during the quarter because assets grew more quickly than capital, but they remain comfortably above basic regulatory minimums. The Federal Reserve similarly describes banking-sector regulatory capital as near historically high levels.
The 2026 stress test reinforces the point for the largest institutions. Under the Federal Reserve’s severe hypothetical recession, participating large banks absorbed more than $708 billion of projected total losses, including approximately $75 billion from commercial real estate, yet aggregate capital declined by only 1.6 percentage points and every tested bank remained above its minimum requirement.
That result cannot simply be transferred to every regional and community bank. Smaller banks have different portfolios, funding structures and regulatory requirements. But it demonstrates that the core of the US banking system has substantially greater loss-absorbing capacity than the financial system that entered 2008.
The Real Vulnerability Is Concentration Relative to Capital
A national capital ratio can conceal an individual bank problem. Imagine two banks with identical capital ratios. One owns a diversified portfolio of residential mortgages, business loans, credit cards and industrial property across the country. The other has a large proportion of its loan book concentrated in offices and multifamily buildings in one metropolitan area.
A 20% decline in one property category might have little effect on the diversified institution but can consume a large part of the second bank’s capital. The relevant ratio is therefore not simply debt to equity but risky exposure relative to capital.
This lesson also comes directly from 2008. The FDIC found that many institutions that subsequently failed had commercial-real-estate and particularly acquisition, development and construction concentrations that were very large relative to their capital. Rapid asset growth and dependence on less stable funding frequently appeared alongside the credit concentration.
The contemporary version is different in composition but similar in principle. Office loans, rent-regulated multifamily exposures or particular construction markets can become disproportionately large compared with the capital available to absorb losses.
Deposits Can Turn a Solvency Problem Into a Liquidity Crisis
The funding side of the balance sheet matters because a bank loan can take years to repay while a depositor can demand money immediately. This maturity mismatch is fundamental to banking and normally functions safely because deposit withdrawals are diversified and predictable.
The 2023 failures demonstrated what happens when that assumption breaks. Large uninsured depositors have a strong incentive to move rapidly if they believe a bank may fail because balances above the federal insurance limit can theoretically suffer losses. Online transfers allow billions of dollars to disappear within hours.
The Federal Reserve’s May 2026 Financial Stability Report judged bank funding vulnerabilities to be roughly in line with historical norms. Uninsured deposits as a share of bank assets remained significantly below the elevated levels reached during the 2023 episode, while large banks retained strong stocks of high-quality liquid assets.
Yet the latest FDIC data provide a reason to continue watching the composition of funding. Estimated uninsured domestic deposits increased by $317.4 billion in the second quarter and were the principal driver of deposit growth. That increase is not evidence of immediate distress — indeed, deposit inflows can be a sign of confidence — but uninsured deposits behave differently from insured retail balances when a bank comes under pressure.
Wholesale Funding Can Stabilise a Bank but Also Increase Its Costs
Regional institutions can replace lost deposits through Federal Home Loan Bank advances, brokered deposits or other wholesale borrowing. These sources provide valuable liquidity and played an important role in stabilising institutions during earlier stress periods.
They are not equivalent to inexpensive relationship deposits, however. Wholesale funding can be more expensive, require collateral and reprice rapidly when market interest rates change. A bank that loses low-cost deposits and replaces them with expensive borrowing can remain liquid while its profitability deteriorates.
This creates a slow feedback mechanism. Higher funding costs compress the net interest margin. Lower earnings reduce the amount of capital generated internally. The bank then has less capacity to absorb credit losses or expand lending. If it attempts to shrink instead, local businesses and property borrowers can find credit less available.
This is one reason a regional-bank problem can affect the real economy even without a bank failure. The institution can remain solvent but become much more conservative.
Bank Lending Conditions Show Caution, Not a Credit Freeze
The Federal Reserve’s July 2026 Senior Loan Officer Opinion Survey provides another important contrast with a systemic crisis. Banks generally reported easing or leaving commercial-real-estate standards unchanged during the second quarter. Standards for nonfarm nonresidential and multifamily lending eased on balance, while construction and land-development standards were broadly unchanged.
That does not mean credit has returned to the unusually loose conditions of the low-rate era. Banks still described CRE standards as being towards the tighter end of their historical range since 2005, particularly for construction and land-development loans. Smaller banks also reported weaker demand for some commercial-property credit even as large banks saw stronger demand.
The picture is therefore one of selectivity rather than paralysis. Banks remain willing to finance good properties and strong borrowers, but leverage, valuations and debt-service coverage are being scrutinised more carefully. Weak projects can no longer assume that refinancing will automatically be available.
This distinction matters for NPL formation. A functioning refinancing market allows viable properties to obtain new loans and leaves the weakest borrowers to be restructured. A frozen market can transform otherwise viable loans into defaults merely because financing disappears.
Private Capital Is Becoming the Buyer of Assets Banks No Longer Want
The other major difference from previous banking cycles is the scale of private credit. Private debt funds, business development companies, insurance-related investors and private-equity groups now provide financing that once would have remained almost entirely inside banks or public securitisation markets.
This gives banks an additional exit route. A regional lender can sell a portfolio of commercial mortgages to a private investor, accept an immediate price adjustment and use the proceeds to reduce wholesale funding or make new loans in sectors it prefers. Private funds, which generally do not finance themselves with instantly withdrawable retail deposits, can sometimes tolerate the long workout period more easily.
But risk does not disappear when a loan leaves a bank. It moves. The Federal Reserve reported that bank credit commitments to nonbank financial institutions had reached $2.6 trillion by the fourth quarter of 2025. Private equity, business development companies and private-credit vehicles formed the largest exposure category, accounting for about one quarter of those commitments under the Federal Reserve’s revised classification.
This creates an important connection between banking and shadow banking. Banks can reduce direct exposure to risky companies or properties while simultaneously lending money to funds that buy similar assets. The transmission channel is more indirect than in 2008, but it still matters for financial stability.
Private Credit Is Beginning to Show Its Own Bad-Loan Cycle
The private-credit sector itself is now experiencing selective deterioration. An analysis of 44 US business development companies published in early September found that reported investment values had moved further below cost during the first half of 2026. Among ten firms for which comparable figures were available, non-accrual investments increased from about 2.5% of portfolio cost at the end of 2025 to approximately 3.4% at the end of June.
The weakness was concentrated particularly in selected software borrowers rather than representing uniform deterioration across the private-credit market. Nevertheless, the development matters because it demonstrates that higher interest rates are testing borrowers outside traditional banks as well.
Private credit therefore functions simultaneously as a pressure-release valve and a new potential transmission mechanism. It can absorb loans that banks no longer wish to hold, reducing deposit-funded banking risk, but highly leveraged or poorly performing borrowers remain economically indebted regardless of who owns the loan.
The financial system of 2026 is consequently more dispersed than that of 2008. That can improve resilience by distributing risk, but it can also make the final location of credit risk harder to see.
2008 Began With a Different Borrower
The strongest argument against describing the current environment as another 2008 is found in American household balance sheets. Before the financial crisis, mortgage underwriting had weakened dramatically. Subprime and Alt-A mortgages, low-documentation lending, high loan-to-value ratios and securitisation structures allowed increasingly risky residential loans to spread through the financial system.
When house prices fell, large numbers of households owed more than their properties were worth. Mortgage defaults increased, securities backed by those mortgages collapsed in value, financial institutions became uncertain about each other’s exposures and wholesale funding markets froze.
The Federal Reserve’s May 2026 assessment is very different. Household balance sheets remain strong overall, most household debt is owed by borrowers with strong credit histories and mortgage delinquency remains low. Large accumulated home-equity cushions and stronger underwriting standards provide protection that was largely absent among the weakest borrowers before 2008.
There are areas of household stress, including some government-insured mortgages, credit cards and auto loans. But the evidence does not show a nationwide residential mortgage system already moving towards the cascading defaults that characterised the global financial crisis.
Yet 2008 Also Contains a Warning for Regional Banks
It would be equally wrong to dismiss the historical comparison entirely. The FDIC’s retrospective study shows that many community-bank failures after 2008 were caused by exactly the kind of concentration risk relevant today: commercial real estate that had been underwritten during optimistic years, financed against high property values and supported by rapid asset growth.
Problem banks increased from only 76 in 2007 to 252 in 2008, 702 in 2009 and ultimately 884 in 2010. Bank failures followed with a delay. There were 25 in 2008, 140 in 2009 and 157 in 2010.
This delay is crucial. Credit crises do not necessarily peak when property prices first fall. A commercial borrower may continue paying for years, receive an extension and only become non-performing when refinancing repeatedly fails. Banks can also take time to recognise the full loss because collateral needs to be reappraised and workouts negotiated.
The lesson from 2008 is therefore not that 2026 must produce hundreds of failures. It is that apparently manageable property losses can continue travelling through bank balance sheets long after the initial change in economic conditions.
Why 2026 Is Similar to 2008 — and Why It Is Different
| Factor | 2008 | 2026 |
|---|---|---|
| Main property stress | Housing, development, CRE | Office and selected CRE |
| Household mortgages | Severe deterioration | Generally strong |
| Bank credit losses | Broad and rapidly rising | Selective and moderate overall |
| Interest-rate losses | Secondary issue | Major balance-sheet issue |
| Deposit-run technology | Slower | Potentially extremely fast |
| Bank capital | Insufficient at many firms | High by historical standards |
| Private credit | Much smaller | Major source of financing |
Analytical comparison based on FDIC and Federal Reserve data and post-crisis assessments.
The Banking System Has More Defences Than It Had in 2008
The post-crisis regulatory framework forced large institutions to hold more and better-quality capital, maintain stronger liquidity buffers and undergo recurring stress tests. Resolution planning is more developed, while regulators monitor capital, liquidity, interest-rate risk and concentrations using data and supervisory practices shaped directly by the failures of 2008 and 2023.
The Deposit Insurance Fund also entered the current period in a stronger position. Its balance reached $161.1 billion in the second quarter of 2026 and its reserve ratio increased to 1.48%. One insured institution failed during the quarter, but the number of problem banks declined.
These defences cannot prevent individual failures. Regulation cannot transform a badly underwritten property loan into a good one, nor can capital make an institution immune to an unlimited depositor run. Their purpose is to give banks and regulators larger buffers before losses become systemic.
The strongest institutions can also acquire weaker banks and loan portfolios. This capacity allows distressed assets to migrate towards balance sheets capable of absorbing them, although continuing consolidation raises separate questions about competition and the long-term role of community banks.
Why Bank Consolidation Is Likely to Continue
The number of US banks has already declined sharply, and the current credit cycle creates further incentives for mergers. Smaller institutions face rising technology, compliance, cybersecurity and funding costs while competing against national banks and nonbank lenders. A difficult CRE portfolio can make the economics of remaining independent even less attractive.
An acquiring bank can purchase a smaller institution, mark the acquired loans to current values and combine branches, technology and management functions. A well-capitalised buyer may therefore be able to resolve credit problems that are disproportionately large for the original lender.
The second quarter alone saw 36 insured institutions merge with other banks, while the total number of insured institutions declined by 41. This should not automatically be interpreted as distress because mergers occur for many strategic reasons. But balance-sheet pressure makes consolidation more likely at institutions where profitability is weak and raising new equity would be expensive.
The probable long-term effect is a banking system containing fewer charters and somewhat larger average institutions, while private-credit funds occupy more of the lending territory once dominated by banks.
Higher Rates for Longer Would Extend the Clean-Up
For regional banks, the most important macroeconomic variable is no longer simply the Federal Reserve’s overnight policy rate. Long-term borrowing costs determine the refinancing economics of commercial property and influence the market value of fixed-rate securities already held by banks.
The early-September rise in global bond yields and renewed inflation concerns linked to higher energy prices demonstrate why the assumption of rapid refinancing relief remains uncertain. Even when short-term rates eventually decline, commercial mortgage rates can remain elevated if long-term Treasury yields, inflation expectations or risk premiums stay high.
That would prolong both sides of the regional-bank problem. Property borrowers would have difficulty refinancing at acceptable debt-service levels, while existing long-duration securities and low-yield fixed-rate loans would remain economically unattractive compared with newly issued assets.
Time nevertheless helps banks if funding remains stable. Securities move closer to maturity, old low-yield loans repay, new lending occurs at higher yields and earnings gradually rebuild capital. The same passage of time that harms weak property borrowers can therefore improve a well-managed bank’s interest-rate position.
The Most Likely Scenario Is a Rolling Balance-Sheet Repair, Not a Sudden Collapse
Based on the latest FDIC, Federal Reserve and OCC evidence, the most plausible scenario for 2026 through approximately 2028 is a prolonged and uneven credit clean-up rather than a systemic banking crisis. This is a scenario assessment, not a certainty. Its central assumption is that the United States avoids a deep recession and that deposit confidence remains broadly intact.
Under this scenario, commercial-property maturities continue forcing borrowers and lenders to acknowledge valuations that were previously postponed. The strongest properties refinance normally. Viable but overleveraged properties receive extensions or additional equity. Weak assets are sold, restructured or foreclosed. Banks continue transferring selected loan portfolios to private investors.
Non-performing loans are likely to rise at some individual regional institutions even while the national NPL ratio remains manageable. Office remains the most persistent structural problem, while selected multifamily markets, construction projects and small-business borrowers generate additional losses. Industrial and other stronger property sectors partly offset the weakness.
Regional banks with strong core deposits, diversified loan books and substantial capital should be able to absorb losses through earnings. Institutions with concentrated CRE exposure, weak profitability, large unrealised losses and unstable uninsured deposits face a materially higher risk of being acquired, recapitalised or, in a smaller number of cases, failing.
The result would resemble a rolling restructuring cycle: quarterly provisions, charge-offs, portfolio sales and mergers rather than the simultaneous seizure of multiple core financial markets seen in 2008.
Why NPL Sales May Increase Even If the Banking System Improves
This scenario contains an apparent paradox. The volume of distressed or unwanted loan sales can increase at the same time that banking-system health improves. More sales do not necessarily mean the crisis is accelerating.
A bank that has spent several years extending loans may eventually decide that property transaction markets are liquid enough to establish credible prices. Selling the asset then becomes easier. The resulting charge-off can temporarily worsen reported earnings while making the future balance sheet safer.
Improving investor confidence can likewise attract private capital willing to purchase portfolios. A frozen market with almost no NPL sales can actually indicate greater uncertainty because buyers and sellers cannot agree on valuations.
The important indicators are therefore the price at which assets are sold, the losses relative to bank capital and whether new NPL formation is running faster than old loans are resolved. Transaction volume by itself cannot answer those questions.
A Mild Recession Would Make the Process More Expensive but Probably Manageable
If economic growth weakens moderately, commercial tenants may reduce hiring and space requirements, small businesses may experience weaker revenue and consumer credit losses could rise. Banks would need larger provisions and NPL formation would accelerate.
Current capital and earnings suggest that the industry as a whole has considerable capacity to absorb such deterioration. The Federal Reserve stress test intentionally assumes conditions much more severe than an ordinary recession and still leaves the tested large banks above minimum capital requirements.
Regional banks with concentrated portfolios would not experience the average outcome, however. A recession affecting a city with high office vacancies could produce losses many times the national rate at a lender heavily exposed to that market.
This is why the most likely future is not “nothing happens”. Some failures and forced mergers are entirely compatible with an otherwise resilient banking system.
The More Dangerous Scenario Requires Several Problems to Arrive Together
A substantially worse outcome would require a combination of shocks. Long-term interest rates would remain high or rise further; the economy would enter a significant recession; office and multifamily values would fall again; borrowers would fail to refinance; and depositors would begin questioning the solvency of exposed regional banks.
Credit losses would then reduce capital while deposit withdrawals increased liquidity needs. Banks could be forced to sell securities carrying unrealised losses, converting an interest-rate problem into a capital problem. Other depositors could then react to those realised losses, creating the same self-reinforcing mechanism observed in 2023.
Private-credit funds could amplify the process if rising defaults forced significant asset markdowns or investor withdrawals. Banks providing credit facilities to those funds would face a second channel of exposure just as their direct loan books deteriorated.
This would still not mechanically reproduce 2008 because household mortgage quality and large-bank capital are very different. It could instead resemble a larger version of the 2023 regional-bank crisis combined with a commercial-real-estate downturn.
That is the adverse scenario regulators have the strongest reason to prevent.
A Genuine 2008-Style Systemic Crisis Would Require the Stress to Become Much Broader
For a true parallel with the global financial crisis, deterioration would have to move well beyond a limited number of commercial-property portfolios. Residential mortgages would need to weaken substantially, corporate defaults would need to spread, market funding would have to become dysfunctional and losses would need to overwhelm capital across multiple major institutions.
Current data do not show that combination. Household and business leverage relative to GDP is lower than in the years surrounding the global financial crisis. Mortgage delinquencies are low overall. Bank capital is high. Funding vulnerability is moderate at most banks, and lending markets continue to function.
The FDIC’s 47 problem banks are particularly revealing when compared with the trajectory after 2008. The crisis did not end with 252 problem banks; the number more than tripled to 884 over the following two years. For a comparable systemic deterioration to emerge now, the current problem-bank population and industry-wide credit metrics would have to worsen dramatically from present levels.
That remains possible under a sufficiently severe economic shock, but it is not the direction indicated by the latest aggregate statistics.
The Most Important Indicator Is Not the Headline NPL Ratio
Investors attempting to assess regional banks should therefore look beyond one national bad-loan number. The quality and concentration of assets matter more. A bank with a 1% NPL ratio concentrated in one deteriorating property market can face greater future risk than a diversified institution reporting a temporarily higher ratio.
The amount of criticised and classified credit can provide an earlier warning than formal NPLs because loans frequently deteriorate internally before becoming non-accrual. Loan modifications, maturity extensions and declining property appraisals also reveal pressure before a borrower misses a payment.
Funding composition is equally important. A high proportion of insured household deposits is generally more stable than a small number of very large corporate balances. The amount of readily available liquidity relative to uninsured deposits therefore deserves attention.
Finally, securities losses need to be analysed relative to capital. A $1 billion unrealised loss means something very different to a bank with $30 billion of capital than to one with $1.5 billion. Absolute numbers alone can exaggerate or conceal risk.
Six Signals Will Show Whether the Base Scenario Is Failing
The first signal would be a renewed national increase in the FDIC’s past-due and non-accrual rate after its recent improvement. The second would be a sustained acceleration in net charge-offs, particularly if losses spread beyond isolated CRE and consumer categories. The third would be a rapid increase in the number and assets of problem banks.
The fourth would be renewed uninsured-deposit flight from regional lenders. Deposit withdrawals were the mechanism that transformed unrealised losses into actual failures in 2023. The fifth would be another sharp fall in commercial-property values accompanied by rising office, multifamily and construction defaults.
The sixth would be signs that private-credit deterioration is feeding back into regulated banks through credit facilities, fund financing or common borrowers. None of these indicators by itself would prove a systemic crisis. A simultaneous deterioration across several of them would materially change the assessment.
The Future of Regional Banking Will Be Decided Property by Property and Bank by Bank
The US regional banking problem is therefore less dramatic than the phrase “banking crisis” suggests but more persistent than reassuring aggregate statistics imply. The system is not currently drowning in NPLs. It is working through a large stock of loans and securities whose economics were shaped by an interest-rate environment that no longer exists.
Commercial real estate provides the clearest example. Some buildings remain valuable and easily financeable. Others can no longer support the debt placed on them years earlier. The difference is only gradually becoming visible as maturities arrive.
Portfolio sales are part of the adjustment rather than proof that every seller is insolvent. NPL packages allow banks to convert uncertain future recoveries into known present losses. Performing-loan sales allow institutions to reduce concentration before distress appears. Private-credit investors increasingly provide the capital that makes both transactions possible.
For individual weak banks, the consequences can still be severe. High CRE concentration, low earnings, thin capital, expensive wholesale borrowing and nervous uninsured depositors remain a dangerous combination. The 2023 failures demonstrated how quickly a balance-sheet weakness can become a run.
For the banking system as a whole, however, the evidence in September 2026 favours a different conclusion from 2008. Capital is stronger, household mortgage credit is healthier, aggregate loan losses are lower, profitability is robust and the number of problem institutions remains within the FDIC’s historical non-crisis range.
The most probable scenario is therefore several more years of restructuring rather than a sudden nationwide collapse: more CRE workouts, more loan-package sales, more selective charge-offs, greater involvement by private credit, continuing mergers and occasional bank failures. The process may be uncomfortable and could restrict credit in exposed regions, but if the economy avoids a deep recession and deposit confidence holds, losses should remain principally a problem of individual institutions rather than a repeat of the global financial crisis.
The central risk lies in the interaction between problems that are currently separate. Commercial-property losses are manageable while capital is strong. Securities losses are manageable while deposits are stable. Private-credit weakness is manageable while funding remains available. A crisis emerges if those conditions deteriorate at the same time. That, rather than the absolute size of any single NPL package, is the threshold that will determine whether America’s slow banking adjustment remains orderly.
Sources
Federal Deposit Insurance Corporation — Quarterly Banking Profile, Second Quarter 2026
Federal Deposit Insurance Corporation — Quarterly Banking Profile, Fourth Quarter 2008
Federal Deposit Insurance Corporation — Crisis and Response: An FDIC History, 2008–2013
Federal Deposit Insurance Corporation — Dissecting Depositor Flight at the 2023 Failed Banks
Federal Reserve Board — Financial Stability Report, May 2026
Federal Reserve Board — Financial Stability Report: Leverage in the Financial Sector
Federal Reserve Board — July 2026 Senior Loan Officer Opinion Survey
Federal Reserve Board — 2026 Bank Stress Test Results
Federal Reserve Board — Pretend or Amend? On Evergreening in Commercial Real Estate
Office of the Comptroller of the Currency — Semiannual Risk Perspective, Spring 2026
Mortgage Bankers Association — Commercial and Multifamily Mortgage Maturities in 2026
Trepp — August 2026 CMBS Delinquency Report
OceanFirst Financial — Completion of $1.3 Billion Multifamily Loan Portfolio Sale
Flagstar Bank — Second Quarter 2026 Results and Asset Quality
Source & Transparency
This article is published by Ireland Newspaper for editorial and informational purposes.
Published: 3 September 2026 · Updated: 3 September 2026

Newsroom Ireland Newspaper
Ireland Newspaper editorial team prepares daily news coverage for readers in Ireland and abroad.




Market data, financial news and economy content on Ireland Newspaper are provided for editorial and informational purposes only. They do not constitute financial advice, investment advice, trading advice or a recommendation to buy, sell or hold any financial product. Always verify live prices and consult a qualified professional before making financial decisions.