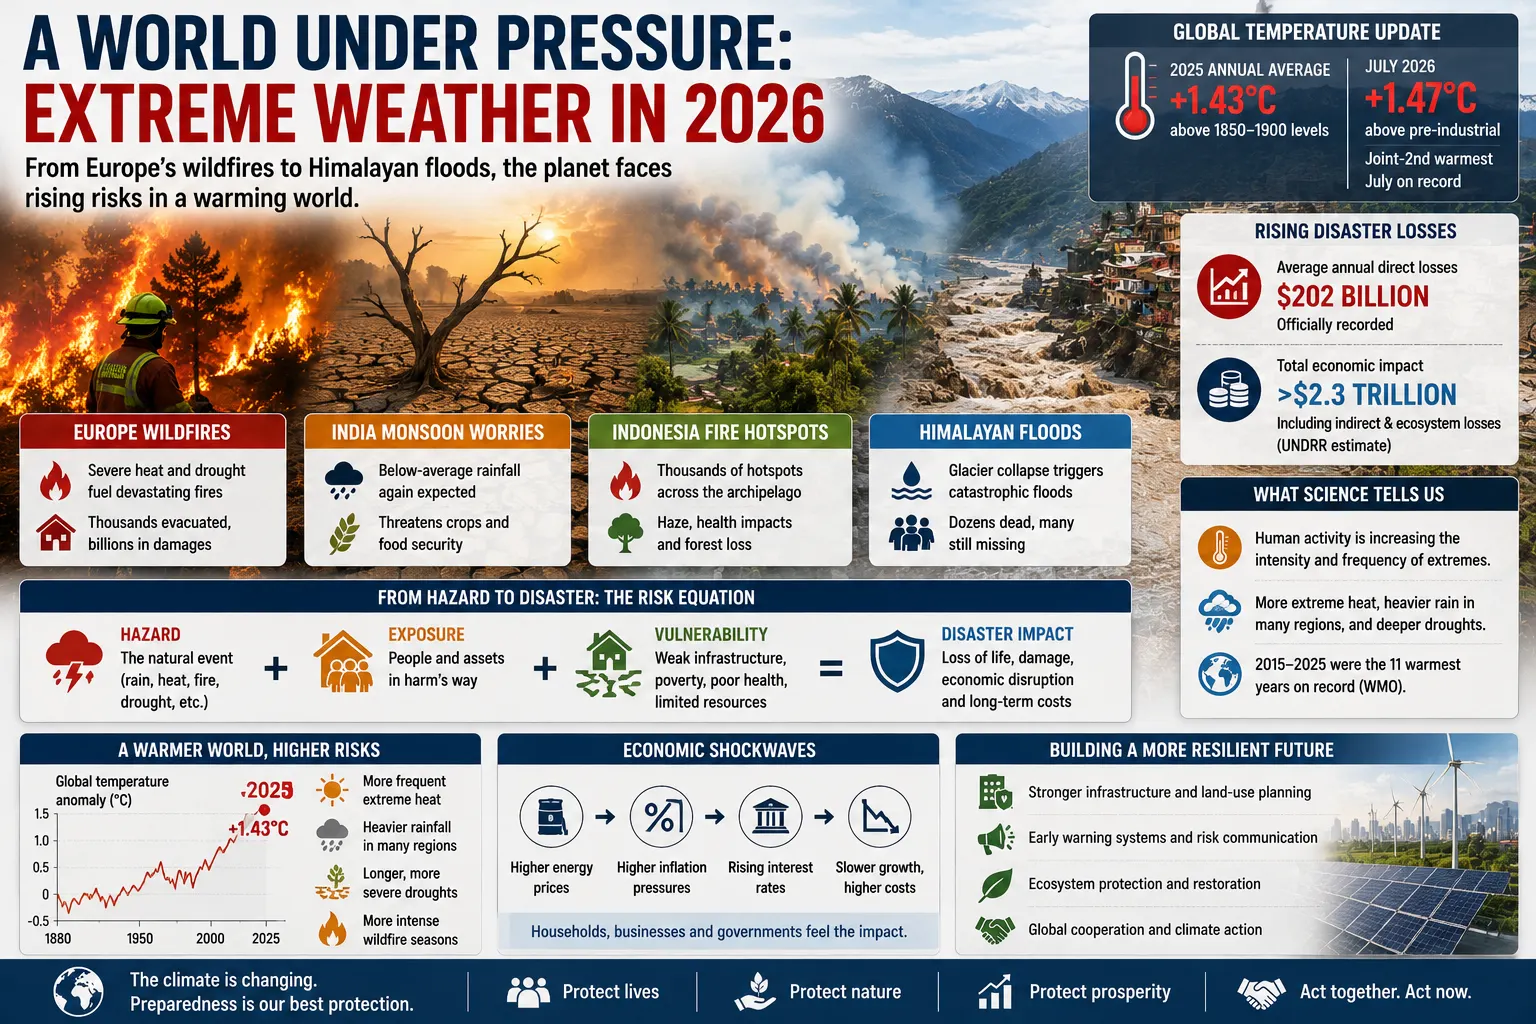
During the final weeks of August 2026, Europe was fighting wildfires after an exceptionally hot and dry summer, India was preparing for another month of weak monsoon rainfall, Indonesia was battling thousands of fire hotspots and rescuers in the Himalayas were searching for victims of a catastrophic flood triggered by a glacier collapse. These events were separated by thousands of kilometres and had different immediate causes, yet together they illustrate a larger change in global risk: extreme weather and climate-related hazards are increasingly interacting with densely populated cities, agricultural systems, fragile ecosystems and infrastructure built for conditions that no longer provide a reliable guide to the future.
The scientific evidence does not support the claim that every flood, drought or wildfire is simply “caused by climate change”. Weather has always produced extremes, El Niño and other natural cycles redistribute heat and rainfall, and local factors such as deforestation, drainage, river engineering, construction on floodplains and fire management can determine whether a meteorological event becomes a catastrophe. What has changed is the background climate in which those events occur. The Intergovernmental Panel on Climate Change concludes that human-induced warming is already increasing the frequency and intensity of hot extremes across most land regions, increasing heavy precipitation in many areas and contributing to agricultural and ecological drought in some regions.
The warming trend is increasingly difficult to separate from everyday economic planning. The World Meteorological Organization confirmed in March that the eleven years from 2015 through 2025 were the eleven warmest on record. Global mean temperature in 2025 was around 1.43°C above the estimated 1850–1900 average. Copernicus subsequently measured July 2026 at approximately 1.47°C above its pre-industrial estimate, making it the joint-second warmest July on record and one of the warmest individual months ever observed globally.
A single year or month above 1.5°C does not mean the Paris Agreement’s long-term temperature threshold has formally been crossed. That objective is measured over a much longer period rather than against temporary annual fluctuations. But the repeated approach to and temporary exceedance of 1.5°C demonstrates how little thermal distance now separates present-day conditions from warming levels at which climate science projects substantially greater extreme-weather risks.
Extreme Weather Is Not New — the Risk Around It Is Changing
Floods, heatwaves, droughts and wildfires appear throughout historical records. Major European heatwaves occurred long before modern climate science, drought repeatedly reshaped agricultural societies, river floods destroyed cities and forest fires formed part of many natural ecosystems. A warming climate does not create these hazards from nothing.
The modern risk emerges from three elements interacting: the physical hazard, human exposure and vulnerability. A severe rainstorm over an uninhabited landscape may cause little economic damage. The same rainfall over a rapidly expanding city with paved surfaces, inadequate drainage and construction on a floodplain can become a major disaster. A wildfire in an adapted ecosystem may be ecologically normal, while a fire entering a densely populated suburban area can destroy billions of dollars of property.
This helps explain why economic losses can rise more rapidly than the physical intensity of hazards alone. Global population has increased, cities have expanded, expensive property and infrastructure occupy coastlines and flood-prone areas, and interconnected supply chains mean damage to one port, railway, power station or factory can affect businesses far beyond the disaster zone. Climate change then alters the probability or severity of several hazards operating across this more exposed system.
UN disaster-risk assessments estimate that officially recorded direct disaster losses average roughly $202 billion a year. The UN Office for Disaster Risk Reduction argues that the wider economic burden exceeds $2.3 trillion annually when indirect effects, ecosystem damage and cascading disruption are included. These broader estimates contain greater uncertainty than direct insured-property calculations, but they demonstrate why counting damaged buildings alone can underestimate the real cost.
What Turns Extreme Weather Into a Disaster
| Factor | Example | Effect on Risk |
|---|---|---|
| Physical hazard | Extreme rainfall, heat or drought | Determines the environmental pressure |
| Exposure | Homes built on floodplains or fire-prone edges | Places people and assets in danger |
| Vulnerability | Weak buildings, poverty or poor health | Increases potential harm |
| Land use | Deforestation, drainage or urban paving | Can amplify floods, drought and fire |
| Preparedness | Forecasting, evacuation and resilient infrastructure | Can sharply reduce casualties and losses |
Sources: IPCC and UN Office for Disaster Risk Reduction.
Heat Is the Clearest Signal of a Warming Climate
Of the major weather extremes, heat has the strongest and most geographically widespread connection to human-induced climate change. The IPCC assesses it as virtually certain that hot extremes, including heatwaves, have become more frequent and intense across most land regions since the 1950s. Human-induced climate change is assessed with high confidence as the main driver of that change.
This relationship follows basic physics. Raising the average temperature shifts the entire distribution of possible temperatures. Conditions that once occurred only near the extreme warm edge consequently become less unusual, while entirely new extremes become possible. The effect is particularly important for multi-day heatwaves because hot nights prevent the human body, buildings and ecosystems from recovering from daytime heat.
The health burden is substantial and partly hidden. The World Health Organization’s July 2026 assessment cites studies estimating approximately 489,000 heat-related deaths annually worldwide during 2000–2019. Heat-related mortality among people aged over 65 increased by about 85 per cent between 2000–2004 and 2017–2021. Heat can worsen cardiovascular, kidney, respiratory and other illnesses, meaning death certificates do not always identify high temperature as the underlying contributor.
Economic effects spread beyond hospitals. Outdoor workers lose safe working hours, air-conditioning demand strains electricity networks, railways and roads can deform, livestock productivity falls and crops experience heat stress. Cities can amplify the problem through the urban heat-island effect as dark roofs, asphalt and concrete absorb solar energy while reduced vegetation limits cooling through evaporation.
Western Europe provided a clear illustration during 2026. Copernicus recorded the warmest June–July period for western Europe in its dataset, accompanied by widespread dry conditions and exceptionally high wildfire danger. By August, fires were forcing evacuations in Spain, France, Croatia, Germany, Greece and other countries. Britain and Wales were also recording unusually extensive wildfire activity following repeated heatwaves.
Wildfire Risk Is More Complicated Than Temperature Alone
Fire requires combustible vegetation, sufficiently dry fuel and an ignition source. Climate can strongly influence the first two conditions, but it does not determine every ignition. Lightning starts some fires; human activity starts many others. Land management, forestry practices, abandonment of agricultural land, peat drainage and the accumulation of combustible material can determine how rapidly flames spread once a fire begins.
The IPCC finds that human influence has probably increased fire weather in some regions of every inhabited continent. Hotter conditions increase evaporation from vegetation and soil, while prolonged drought allows grass, shrubs and forests to become increasingly combustible. Wind can then transform a manageable fire into a rapidly moving front that overwhelms firefighting resources.
The geographical consequences vary. Southern European countries have long experienced Mediterranean wildfires, but recent extreme fire seasons have expanded concern farther north. In July 2026, Copernicus described much of western, central and eastern Europe as drier than average, with extremely low river flows in several areas and conditions favourable to major fires. Spain’s firefighting aircraft had already exceeded the previous year’s flying hours by mid-August.
Indonesia demonstrates a different fire system. During August 2026, more than 9,000 hotspots were detected as a strengthening El Niño intensified an already severe dry season. Nearly 95,000 hectares burned during July alone. Fires on drained peatlands are particularly difficult to extinguish because organic soils can burn underground and continue producing smoke long after surface flames appear controlled.
Climate is only part of that story. Deforestation, peatland drainage and the historical use of fire for land clearing have contributed substantially to Indonesia’s recurrent fire problem. Government restoration projects and enforcement introduced after the disastrous 2015 fire season have reduced some vulnerabilities, but extreme dryness can expose the remaining structural weaknesses. This distinction matters because some wildfire risk can be reduced locally even while global temperatures continue rising.
Why a Warmer Atmosphere Can Produce More Extreme Rainfall
A warmer atmosphere can hold more water vapour. At the broad physical level, atmospheric moisture capacity increases by roughly 7 per cent for each degree Celsius of warming under otherwise comparable conditions. That does not mean rainfall rises everywhere by 7 per cent, because atmospheric circulation determines whether moisture actually condenses and falls. It does mean that storms capable of drawing on sufficient moisture have greater potential to produce intense rainfall.
The IPCC finds that heavy precipitation has increased since the 1950s across most land areas where observations are sufficiently complete to analyse the trend, with human-induced climate change assessed as likely the main driver. Globally, the intensity of heavy precipitation is expected to increase further with additional warming.
Extreme rainfall and flooding are not identical. Flood severity also depends on whether soil is already saturated, how rapidly rain falls, the capacity of reservoirs and drainage systems, the condition of rivers and whether urban development prevents water from soaking into the ground. Two cities receiving the same quantity of rain can therefore experience completely different levels of damage.
China faced that interaction repeatedly during the summer of 2026. In late August, Typhoons Narra and Saudel formed part of a rare group of simultaneous storms across the Northwest Pacific and South China Sea. Heavy rainfall pushed rivers above warning levels, flooded low-lying areas and led authorities to evacuate tens of thousands of people. Tropical cyclones occur naturally, and the IPCC does not find a clear global increase in the total number of all-category tropical cyclones. It does, however, assess with high confidence that human-induced warming increases the heavy rainfall associated with tropical cyclones.
Mountain Regions Face a Growing Category of Cascading Hazard
The Himalayan catastrophe of August 2026 illustrated a different type of risk. A large glacier collapse near the Nepal-Tibet border sent ice, rock, mud and water through mountain river systems, killing hundreds of people and destroying roads, bridges, settlements and energy infrastructure. Debris subsequently created unstable lakes, generating the danger of secondary floods even after the first destructive surge had passed.
Scientists investigating the disaster warned against reducing its cause to one variable. Glacier geometry, unstable slopes, geological conditions and short-term weather all require examination. Unusually warm conditions may have contributed to snow and ice instability, but determining the precise causal role of climate change in an individual collapse requires specialised attribution and geological analysis.
The wider Himalayan trend is less ambiguous. Mountain glaciers are retreating across much of the world as temperatures increase. Retreat can destabilise slopes, form new glacial lakes and expose rock previously supported by ice. When landslides, avalanches or ice collapses enter those lakes or rivers, the resulting hazard can move rapidly downstream through populated valleys.
These are examples of cascading disasters: one physical event creates another, which then affects infrastructure, water supply, health services and transport. Conventional emergency planning designed around a single hazard can struggle with such sequences. WMO has consequently identified glacial-lake outburst floods among the emerging hazards that modern early-warning systems increasingly need to address.
Drought Can Develop Even Without Record-Low Rainfall
Drought is equally complex because the word describes several related but different conditions. Meteorological drought concerns prolonged rainfall deficits. Agricultural drought occurs when insufficient soil moisture damages crops and vegetation. Hydrological drought affects rivers, reservoirs and groundwater. A region can experience one without immediately experiencing all three.
Higher temperature can worsen agricultural drought even if rainfall changes relatively little. Warmer air increases evaporative demand, drawing more moisture from soils and vegetation. The IPCC finds evidence that human-induced climate change has contributed to increased agricultural and ecological drought in some regions and projects stronger drought risks in several already-dry parts of the world as warming increases.
Europe again provided a striking example in 2026. Copernicus reported substantially below-normal soil moisture and river flows across large parts of western and central Europe during July. The Danube fell so low during August that nuclear-power operations in Hungary and Romania were affected because reactors depend on river water for cooling. This demonstrates how drought can become an energy-security problem rather than remaining solely an agricultural issue.
India entered September facing a different form of water stress. The India Meteorological Department reported that August monsoon rainfall was 16 per cent below normal and forecast September rainfall below 91 per cent of the long-term average. Because roughly half of India’s farmland lacks irrigation, rainfall conditions can affect agricultural output, rural incomes and later winter planting. The developing El Niño is an important influence on the current monsoon pattern, meaning the immediate 2026 drought risk cannot be attributed to long-term climate change alone.
Central America’s Dry Corridor was also experiencing severe crop losses by the end of August. Aid organisations reported widespread losses among maize-growing households in Guatemala, Honduras and El Salvador as El Niño intensified regional drought. These farming systems are particularly vulnerable because many households depend on small rain-fed plots for both income and food.
El Niño Can Intensify Extremes Without Explaining the Long-Term Trend
The distinction between climate change and El Niño is essential to understanding 2026. El Niño is a naturally recurring warming of the central and eastern tropical Pacific associated with major shifts in atmospheric circulation. It can alter rainfall, storm activity and temperature patterns across much of the world.
The WMO confirmed during 2026 that El Niño had developed rapidly and was expected to strengthen through the northern-hemisphere autumn. Its July seasonal update projected a strong event for August through October, alongside an increased probability of above-normal temperatures over much of the world and substantial shifts in regional rainfall.
El Niño can therefore help explain why one particular year is hotter or why specific regions become wetter or drier than usual. It does not explain the multi-decadal rise in global temperature. The natural cycle is now operating on top of an atmosphere and ocean already warmed by greenhouse-gas emissions.
This combination can produce compound effects. The strong 2023–2024 El Niño temporarily added warming on top of the long-term trend and contributed to record global temperatures. The developing 2026 event similarly increases the possibility that already elevated global temperatures and ocean heat will interact with natural rainfall shifts to produce unusually severe regional extremes.
Examples of Extreme-Weather Pressure in 2026
| Region | Hazard | Important Drivers |
|---|---|---|
| Western Europe | Heat, drought and wildfire | Exceptional warmth, dry soils and vegetation |
| Indonesia | Peat and forest fires | El Niño dryness, land management and peat drainage |
| India | Weak monsoon and drought risk | Rainfall deficit and developing El Niño |
| China | Flooding and typhoon rainfall | Tropical cyclones, moisture and local exposure |
| Nepal and Tibet | Glacier-collapse flood | Mountain instability with climatic and geological factors |
| Central America | Agricultural drought | El Niño, rain dependence and existing water stress |
Sources: WMO, Copernicus Climate Change Service, national meteorological agencies and Reuters reporting through 31 August 2026.
The Cost of Disaster Depends Heavily on Where It Strikes
Physical scale alone does not determine economic loss. UNDRR estimates that wildfires burned approximately 390 million hectares globally during 2025. Yet the costliest wildfire disaster of that year was concentrated in and around Los Angeles, where around 23,000 hectares burned. Munich Re estimated approximately $53 billion in total damage from those fires, around $40 billion of it insured.
The contrast illustrates the role of exposure. A relatively small burned area containing expensive residential property, utilities, roads and businesses can generate far greater measured financial damage than a much larger fire in a sparsely populated landscape. This is also why richer economies frequently record the largest monetary losses even when poorer countries suffer much higher mortality or a far larger economic loss relative to national income.
Insurance partly absorbs these shocks, but coverage is highly uneven. Global natural-hazard losses in 2025 were estimated at approximately $224 billion, with less than half insured. Households and governments therefore carried much of the remaining burden directly.
Repeated disasters can also change whether insurance is available at all. Insurers respond to increasing expected losses by raising premiums, restricting coverage or withdrawing from particularly exposed markets. Property that remains physically habitable can consequently become more difficult to insure, finance or sell. Climate risk then becomes a financial-system and housing-market issue even before another disaster occurs.
Agriculture Experiences Extremes Through Prices as Well as Crop Losses
Farming is unusually exposed because production depends directly on temperature, rainfall and water availability. Heat during flowering can sharply reduce yields, drought can weaken crops over months and a flood can destroy an entire harvest within hours. Livestock face heat stress, reduced pasture and water shortages.
Extreme weather can therefore move rapidly from a farm to a supermarket. Poor harvests tighten supply, livestock losses reduce future production and higher insurance or irrigation costs are incorporated into food prices. When several major producing regions experience adverse weather simultaneously, international commodity markets can amplify the effect.
Europe’s 2026 growing season illustrates the process. Severe summer heat and drought reduced expectations for maize, sugar beet and other crops. French sugar producer Tereos forecast beet yields more than 20 per cent below the previous year and expected EU sugar production to fall to its lowest level in decades. Such company forecasts remain subject to final harvest conditions, but they show how weather moves directly into industrial food supply chains.
The burden is generally greater for subsistence farmers in lower-income countries. A commercial farm can sometimes purchase insurance, irrigation or alternative feed. A household growing maize and beans on a small rain-fed plot may lose food and income simultaneously. Climate adaptation is therefore partly an agricultural-technology problem but also a question of credit, infrastructure and social protection.
Cities Can Either Amplify Extremes or Reduce Their Impact
Urbanisation is one of the most important non-climatic factors behind rising disaster exposure. More than half of humanity now lives in cities, and urban populations continue expanding. Development frequently extends towards coastlines, river valleys and hillsides because those locations are economically attractive even when they carry significant natural hazards.
Paved surfaces reduce the ability of rainfall to soak into soil, producing rapid runoff during intense storms. Storm drains designed using historical rainfall assumptions can become overwhelmed. Underground transport, electrical substations and road tunnels create additional pathways for water to disrupt an entire city.
Heat operates differently but is influenced by many of the same planning decisions. Dense neighbourhoods with limited trees and extensive dark surfaces can remain several degrees warmer than surrounding countryside, particularly at night. Poorly insulated housing can trap heat while residents without air conditioning face the greatest exposure.
These vulnerabilities are not inevitable. Permeable surfaces, restored wetlands, larger drainage systems, urban trees, shaded public areas, cool roofs and building standards designed for future rather than historical temperatures can reduce losses. The challenge is that adaptation often requires investment before the disaster that demonstrates its value.
Water Infrastructure Was Designed for a Climate That Is Changing
Reservoirs, drainage networks, flood barriers and irrigation systems are normally engineered around probabilities calculated from historical observations. A bridge might be designed to withstand a flood statistically expected once in a century. A reservoir may be operated around historical seasonal rainfall. A sewer system may be sized for precipitation patterns measured decades earlier.
Climate change complicates this assumption of stationarity — the idea that the future statistical distribution of weather will resemble the past. If extreme rainfall becomes more intense, the old “one-in-100-year” event may occur more frequently. If prolonged drought becomes more likely, reservoirs designed around previous dry periods may contain insufficient storage.
Infrastructure itself can also create interconnected failures. Drought can reduce hydropower and nuclear cooling capacity. Heat increases electricity demand precisely when power systems are under stress. Floods can disable substations and water-treatment plants. Wildfires damage electricity transmission lines and telecommunications.
The economic effect is therefore often larger than the replacement value of the damaged asset. When a road closes, workers cannot reach jobs and goods cannot reach factories. When electricity fails, refrigeration, banking and telecommunications may stop. This is why resilient infrastructure produces benefits across an economy rather than merely protecting the infrastructure owner.
World Bank research has estimated that every dollar invested in more resilient infrastructure in low- and middle-income economies can generate approximately four dollars of benefits over the asset’s lifetime through avoided damage and reduced disruption. The precise return varies between projects, but the broad conclusion is that adaptation can be economically productive rather than simply an emergency expense.
Early Warning Has Already Demonstrated That Death Tolls Can Fall
One of the most encouraging developments is that greater physical hazard does not automatically have to produce greater mortality. Weather forecasting, telecommunications, evacuation planning and emergency management have improved dramatically over recent decades. Tropical cyclones that would once have struck with little warning can now frequently be tracked for days.
WMO data show that reported deaths from weather, climate and water-related hazards declined substantially between the 1970s and the 2010s even as economic exposure increased. Countries with more comprehensive multi-hazard early-warning systems have disaster-related mortality almost six times lower than countries with limited capabilities, according to the 2025 global early-warning assessment.
Coverage nevertheless remains incomplete. In 2025, 119 countries — about 60 per cent of countries — reported having a multi-hazard early-warning system. Only 43 per cent of small island developing states reported such systems, and significant gaps remain in Africa and other vulnerable regions.
The UN’s Early Warnings for All initiative aims for universal coverage by the end of 2027. Achieving that goal involves more than issuing a weather forecast. Authorities need observation networks, accurate hazard models, knowledge of which communities are vulnerable, communications capable of reaching people and practical plans enabling them to act when a warning arrives.
Better forecasts can reduce casualties even as hazards intensify. The challenge is to connect scientific prediction with communications, evacuation, health systems and infrastructure capable of acting before an extreme event becomes a disaster.
Climate Attribution Requires More Precision Than Political Debate Often Allows
Modern climate science increasingly attempts to determine whether human-caused warming changed the probability or intensity of individual extreme events. These attribution studies compare observations and climate-model simulations of the real warmed world with estimates of a world without the increase in greenhouse gases caused by human activity.
The strength of conclusions varies between hazards. Heatwaves are generally easier to attribute because the underlying warming signal is strong and physically straightforward. Heavy rainfall can also be analysed effectively in many cases. Drought involves rainfall, soil moisture, evaporation and local water management, making conclusions more regionally specific. Wildfire attribution must separate fire weather from ignition and land-management effects.
This is why two statements can simultaneously be true: climate change is increasing the probability of many extremes, while climate change may not be demonstrably responsible for every individual disaster. Responsible analysis separates the long-term change in hazard from local factors determining damage.
The distinction also matters for policy. Reducing greenhouse-gas emissions addresses the long-term intensification of climate hazards. Better land management, drainage, building standards and emergency planning reduce vulnerability. Neither approach can substitute fully for the other.
Every Additional Half Degree Changes the Odds
Climate projections show that future risk does not suddenly begin at one particular temperature threshold. It increases progressively with additional warming. The IPCC estimates that a hot-temperature extreme over land which would have occurred approximately once every ten years in a pre-industrial climate would occur about 4.1 times per decade at 1.5°C of warming and about 5.6 times at 2°C.
For heavy daily precipitation, the equivalent once-in-a-decade event is projected to occur around 1.5 times per decade at 1.5°C warming and around 1.7 times at 2°C. Agricultural and ecological drought events in regions projected to become drier also increase in frequency and severity, although the geographical pattern is less uniform than for temperature.
These numbers are global or multi-region statistical assessments rather than predictions for an individual town. Local geography can produce much larger or smaller changes. Their significance lies in showing why apparently modest differences in average global temperature can materially change the frequency with which infrastructure, agriculture and emergency services encounter conditions previously regarded as rare.
How Additional Global Warming Changes Extreme-Event Frequency
| Extreme | At 1.5°C Warming | At 2°C Warming |
|---|---|---|
| 10-year hot extreme | About 4.1 times per decade | About 5.6 times per decade |
| 10-year heavy rainfall event | About 1.5 times per decade | About 1.7 times per decade |
| 10-year agricultural/ecological drought in drying regions | About 2.0 times per decade | About 2.4 times per decade |
Source: IPCC Sixth Assessment Report, Working Group I. Frequencies are relative to equivalent events in the 1850–1900 climate and contain uncertainty ranges.
The Next Five Years Are Expected to Remain Exceptionally Warm
The WMO’s May 2026 annual-to-decadal forecast provides the clearest official near-term outlook. It projects individual annual global temperatures during 2026–2030 between approximately 1.3°C and 1.9°C above the 1850–1900 average. There is an estimated 86 per cent probability that at least one year during the period will surpass 2024 as the warmest year observed.
The probability that at least one individual year temporarily exceeds 1.5°C is estimated at 91 per cent. Again, a temporary exceedance is different from the long-term Paris Agreement threshold. The important operational implication is that governments and industries planning only for historical climate averages are increasingly likely to underestimate the conditions encountered during the life of infrastructure being built today.
Near-term forecasts do not mean every year will be hotter than the previous one. La Niña can temporarily reduce global temperature, volcanic eruptions can influence the climate and regional weather will continue fluctuating substantially. Long-term warming occurs beneath those year-to-year movements.
The Arctic is expected to continue warming faster than the global average, while declining snow, glacier and sea-ice conditions create additional regional consequences. Changes in frozen water influence sea level, freshwater supply, ecosystems and hazards in mountain regions.
By 2035, Adaptation Financing Could Become a Much Larger Economic Question
The physical climate is only one side of the future. Whether disasters become more destructive depends heavily on how much countries invest in adaptation during the next decade. The United Nations Environment Programme estimates that developing countries may require between approximately $310 billion and $365 billion per year for climate adaptation by 2035.
International public adaptation finance reaching developing countries was only about $26 billion in 2023, according to UNEP’s latest comprehensive assessment. Methodologies and finance definitions remain contested, but the gap between identified needs and existing international public flows is nevertheless very large.
Adaptation includes seawalls and flood protection, but it is much broader. Irrigation, drought-resistant crops, wildfire management, cooling centres, heat-health plans, disease surveillance, reinforced electricity networks, improved drainage, weather observation and climate-resilient housing all form part of the response.
The timing of spending matters. Rebuilding the same damaged infrastructure after repeated disasters can be more expensive than strengthening it beforehand. Yet governments facing debt, healthcare, education and security pressures frequently struggle to justify spending on risks whose benefits are measured partly through disasters that never occur.
Poorer Countries Face a Different Kind of Climate Economics
A billion-dollar disaster does not have the same economic meaning everywhere. In a large wealthy economy, governments and insurers may absorb substantial losses while reconstruction begins quickly. In a small or heavily indebted country, a much smaller event can destroy infrastructure representing a major share of annual economic output.
Lower-income countries also tend to have less insurance, smaller emergency budgets and weaker infrastructure. A government may borrow to rebuild after a flood, increasing debt-service costs and reducing money available for schools, healthcare or future resilience. Another disaster can then arrive before the previous debt has been repaid.
This is the cycle highlighted by the UN’s latest disaster-risk assessment: disaster damage can reduce income, increase public borrowing, raise financial risk and make subsequent resilience investment more difficult. Extreme weather therefore has the potential to widen existing differences between countries even when richer economies experience larger losses in absolute dollars.
Within countries, the same pattern occurs between households. A wealthy family may insure a home, temporarily relocate and finance repairs. A low-income family living in informal housing may lose the entire asset base on which its financial security depends. Disaster statistics measuring national losses can therefore conceal radically different individual outcomes.
Food and Water Could Become the Most Persistent Sources of Pressure
Future climate risk is often illustrated using spectacular wildfires and floods because they produce dramatic images. Agricultural and water stress may prove more persistent economically. Repeated moderate drought can lower yields over several years, reduce groundwater reserves and gradually weaken rural economies without producing one identifiable disaster day.
Water systems also connect competing users. Reservoirs supply households, farms, industry and electricity generation. During prolonged drought, maintaining one use can mean restricting another. Population growth and urbanisation can intensify those conflicts independently of climate change.
Global food markets provide some protection because poor harvests in one region can be offset by exports from another. That resilience weakens when multiple important producing regions experience heat, drought or flood simultaneously. Countries that restrict food exports to protect domestic consumers can then amplify international price shocks.
Agricultural adaptation will consequently involve both farm technology and international trade. Crop varieties, irrigation efficiency, soil management and improved forecasting can reduce local risk, while diverse international supply chains reduce dependence on a single producing region.
Wildfire Management Is Likely to Change Profoundly
Suppressing every fire is not necessarily a sustainable strategy. Some forests and grasslands evolved with periodic burning, and decades of total suppression can allow vegetation to accumulate into unusually heavy fuel loads. Prescribed burning, mechanical thinning and landscape management can reduce the intensity of future fires in appropriate ecosystems.
These interventions are politically and technically difficult. Controlled burns create smoke and carry a small possibility of escape. Removing vegetation can be expensive. Property development continues in the wildland-urban interface, where houses and natural vegetation meet.
Building standards therefore matter alongside forest policy. Fire-resistant roofs, cleared vegetation around buildings, underground electricity distribution in some high-risk areas and evacuation routes can reduce losses even when wildfire itself cannot be prevented.
Indonesia’s peatlands require a different strategy. Rewetting drained peat can reduce fire risk because saturated peat is far harder to ignite. Preventing illegal burning and monitoring concessions remain necessary as well. The appropriate adaptation therefore depends on the ecology and land-use system rather than one universal wildfire policy.
Flood Protection Will Increasingly Need to Make Space for Water
Traditional flood policy frequently attempted to move water away as rapidly as possible through higher embankments, straighter rivers and larger drainage channels. These measures remain essential in many locations, but they can transfer risk downstream or become overwhelmed as extreme rainfall intensifies.
Modern approaches increasingly combine engineered protection with natural systems. Wetlands store water, restored rivers can spread into designated flood areas and urban parks can temporarily function as retention basins. Permeable streets and green roofs slow runoff before it reaches drainage networks.
This does not eliminate the need for hard infrastructure. Dense cities may still require enormous storm-water tunnels, pumping systems and barriers. Coastal communities face the additional combination of heavy rainfall, storm surge and rising sea level.
The difficult political question is where adaptation becomes impractical. In the highest-risk locations, repeated rebuilding may eventually cost more than relocating structures or restricting new construction. Managed retreat is socially contentious because property, community and identity cannot be reduced to engineering calculations.
Heat Adaptation May Produce Some of the Fastest Benefits
Compared with large flood barriers or water infrastructure, many heat adaptations can be implemented relatively quickly. Cities can plant shade trees, modify working hours, establish cooling centres and introduce heat-health warning systems. Building codes can require shading, ventilation and materials better suited to higher temperatures.
Healthcare systems can identify vulnerable elderly or chronically ill residents before heatwaves begin. Employers can provide rest periods, drinking water and adjusted schedules for outdoor workers. Schools and care facilities can prepare temperature-response plans.
These measures do not prevent the temperature from rising, but they can substantially reduce mortality. WHO emphasises that many negative health effects of heat are predictable and preventable when public-health agencies respond before extreme conditions arrive.
Longer-term urban design can provide additional benefits unrelated to climate. Trees and parks improve air quality and public space. Better insulation can reduce both summer cooling and winter heating costs. Adaptation therefore does not always represent an expenditure whose only return appears during a disaster.
Mitigation and Adaptation Solve Different Parts of the Problem
There is sometimes a false choice between reducing emissions and adapting to the climate that already exists. The two policies operate on different timescales. Adaptation reduces damage from heat, flood, drought and fire that societies are already experiencing or can no longer completely avoid. Emissions reductions influence how much additional warming and risk accumulate over coming decades.
The latest UNEP emissions assessment estimated that full implementation of existing national climate commitments would still leave the world on a pathway towards approximately 2.3°C to 2.5°C of warming over this century. Policies actually in place were estimated to correspond to roughly 2.8°C. These are modelled trajectories subject to future policy and technological change, not predetermined outcomes.
The difference between those warming levels matters because extreme-event probabilities do not increase linearly in every case. The IPCC shows particularly rapid increases in the frequency of rare heat events as temperatures rise. Adaptation also becomes more difficult at higher warming levels as physical thresholds and repeated disasters reduce the time available for recovery.
Conversely, adaptation remains necessary even under rapid emissions reductions because greenhouse gases already emitted have changed the climate and infrastructure built today will operate for decades. A flood defence, railway or hospital designed in 2026 must function in the climate of the 2040s and 2050s, not merely in the statistical weather of the twentieth century.
The Future Is Not Simply a Forecast of More Disasters
The most important uncertainty is not whether the climate will continue changing in the near term; warming over the next several years is already strongly constrained by accumulated greenhouse gases and natural variability. The larger uncertainty concerns how societies respond.
A more hazardous climate can coexist with falling mortality when forecasting, buildings and emergency management improve. Bangladesh’s cyclone preparedness, heat-warning systems in European cities and increasingly accurate global weather forecasting demonstrate that vulnerability can change substantially. Conversely, rapid construction in exposed areas can increase disaster losses even where the underlying climate hazard changes comparatively little.
Technology will contribute. Higher-resolution weather models, artificial intelligence, satellite observations and inexpensive sensors can improve flood and wildfire forecasting. Drones can map fires and disaster zones. New crop varieties and precision irrigation can reduce agricultural exposure. Better risk models can influence insurance and construction.
Technology cannot remove difficult political decisions. Governments still determine where homes can be built, how water is allocated, which infrastructure receives investment and how costs are shared between taxpayers, property owners and insurers. Extreme weather is therefore becoming as much a governance and economic-planning challenge as a meteorological one.
What Can Change the Future Risk
| Action | Primary Purpose | Time Horizon |
|---|---|---|
| Early-warning systems | Reduce deaths and emergency losses | Immediate to short term |
| Resilient infrastructure | Reduce damage and service disruption | Years to decades |
| Land-use reform | Limit exposure to floods and fires | Long term |
| Agricultural adaptation | Protect food production and water use | Short to long term |
| Emissions reduction | Limit additional climate change | Decades and beyond |
Ireland Newspaper analysis based on IPCC, WMO, UNEP, UNDRR and World Bank assessments.
What to Watch During the Rest of 2026
The developing El Niño will be the most important natural climate influence during the coming months. WMO expects the event to strengthen and says above-normal temperatures are likely across much of the world. El Niño tends to increase drought risk in some regions while bringing above-normal rainfall to others, but precise effects vary geographically and between individual events.
India’s monsoon and agricultural season will provide an immediate test of drought resilience. Soil moisture entering the winter-crop planting season will matter alongside total rainfall. Central American food security will also depend heavily on whether rainfall improves sufficiently for small farmers affected by the current Dry Corridor drought.
Indonesia’s fire season will indicate whether peatland restoration and stronger firefighting capacity can contain exceptionally dry conditions. Smoke movement across international borders can quickly transform a domestic land-management problem into a regional public-health and diplomatic issue.
Europe will enter autumn after an extraordinary summer of heat, drought and fire. Reservoir levels, river flows, soil moisture and the condition of forests will determine how quickly the region recovers. Heavy autumn rain falling on severely burned landscapes could itself create new erosion and flash-flood hazards.
The Himalayas will face intensified scrutiny following the August catastrophe. Monitoring unstable glaciers, slopes and debris-dammed lakes is becoming increasingly important as warming alters high-mountain environments. The event also demonstrates why international data sharing matters where hazards cross borders before emergency services can react.
The Most Important Change May Be How Governments Define Normal
Infrastructure, farming calendars, insurance models and emergency plans have traditionally been built around historical climate statistics. That approach worked reasonably well when the climate varied around a comparatively stable long-term average. It becomes progressively less reliable when the average itself is moving.
The challenge is not that every year will produce a record flood, drought or wildfire. Most locations will continue experiencing ordinary weather most of the time. The change lies in the statistical tails: conditions once considered unusually hot, wet or dry become less unusual, while some new extremes move beyond previous experience.
This means a resilient society cannot simply rebuild after each disaster to the standard that existed before it. Reconstructing a bridge at the same height, a house with the same materials or an electricity network to the same temperature specification can reproduce the vulnerability that caused the loss.
The economic argument for adaptation therefore rests on anticipating future conditions rather than waiting for damage. The difficulty is deciding which projections should guide investments when regional uncertainty remains substantial. Designing everything for the most extreme conceivable scenario would be prohibitively expensive; designing for twentieth-century averages may be increasingly inadequate.
Extreme Weather Is Becoming a Test of Economic Resilience
The events of 2026 show why the issue can no longer be treated solely as an environmental discussion. Heat affects labour productivity and health. Drought influences food, electricity and shipping. Floods damage housing and supply chains. Wildfires affect tourism, insurance and air quality. A glacier collapse in a remote mountain region can destroy international transport infrastructure and hydropower within minutes.
At the same time, the geography of risk remains highly uneven. Some regions are becoming wetter while others dry. Wealthy cities may face enormous insured losses but possess the resources to rebuild, while poorer communities can suffer lasting economic damage from events much smaller in monetary terms. Local land-use decisions can either amplify or reduce the physical climate signal.
The clearest scientific conclusion is therefore not that every disaster has one cause. It is that the baseline conditions governing many extremes are changing, particularly for heat and heavy rainfall, with significant regional evidence for worsening drought and fire weather. Natural cycles such as the strengthening 2026 El Niño can temporarily intensify or redistribute those risks.
The near future is unlikely to provide relief through a return to the climate of previous decades. WMO expects global temperatures to remain near record levels through 2030, while adaptation requirements are rising towards hundreds of billions of dollars a year in developing countries alone. Decisions on construction, agriculture, water, insurance and emergency preparedness made during the rest of this decade will therefore shape not only how much extreme weather occurs, but how destructive it becomes.
The global challenge is ultimately one of managing two processes simultaneously. Societies must prepare for the warmer climate that already exists while limiting how much additional warming occurs in the future. Floods, droughts and wildfires cannot all be prevented, but whether an extreme event becomes a humanitarian and economic catastrophe remains far more open to human choices than the weather itself.
Sources
World Meteorological Organization — State of the Global Climate 2025
Copernicus Climate Change Service — Global surface air temperature, July 2026
Copernicus Climate Change Service — Precipitation, soil moisture and river flow, July 2026
Copernicus Climate Change Service — European heat, drought and wildfire conditions, August 2026
World Meteorological Organization — Strong El Niño outlook, July 2026
World Meteorological Organization — Global Annual-to-Decadal Climate Update 2026–2030
UN Office for Disaster Risk Reduction — Global Assessment Report 2025
UN Office for Disaster Risk Reduction — Global wildfire and disaster losses in 2025
UN Environment Programme — Adaptation Gap Report 2025
UN Environment Programme — Emissions Gap Report 2025
World Health Organization — Heat and Health, July 2026
World Bank — Economic benefits of resilient infrastructure
Reuters — European wildfires and extreme heat, August 2026
Reuters — Indonesia’s 2026 wildfire season
Reuters — India’s monsoon rainfall outlook, 31 August 2026
Reuters — Nepal-Tibet Himalayan flood, August 2026
Reuters — Typhoons and flooding in China, August 2026
Reuters — El Niño and crop losses in Central America’s Dry Corridor, August 2026
Source & Transparency
This article is published by Ireland Newspaper for editorial and informational purposes.
Published: 1 September 2026 · Updated: 1 September 2026

Newsroom Ireland Newspaper
Ireland Newspaper editorial team prepares daily news coverage for readers in Ireland and abroad.